End-to-End IPL Data Analysis with Python and Power BI
Unveiling Cricket's Digital Scorecard: A Python-Powered Exploration through IPL Data with Dynamic Power BI Insights
Table of contents
Introduction
In the ever-evolving landscape of data science and analytics, I embarked on a transformative journey over the past few months. With newfound knowledge in Python, Power BI, SQL, and other essential tools, the time had come to apply these skills to a real-world project. Inspired by a love for cricket, I set out to explore the intricate details hidden within IPL data. This blog chronicles my venture from learning to project, showcasing the power of Python, Hugging Face, and Power BI in unraveling the secrets of cricket analytics.

Project Overview
A Passion-Driven Choice
The decision to delve into data analytics with IPL data was a natural one. By choosing a topic that resonated with my interests, I aimed to accelerate my learning process and dive into the world of sports analytics.

Python Data Extraction: Tapping into ESPNCricinfo
The project commenced with the development of a Python script designed to extract IPL data from the ESPNCricinfo API. This script proved instrumental in obtaining a comprehensive dataset, laying the groundwork for subsequent analysis.
Hugging Face Hosting: A Hub for Data
Recognizing the need for a reliable data hosting solution, I turned to Hugging Face. The platform not only facilitated straightforward data hosting but also allowed for seamless updates, ensuring that the dataset remained current and relevant.
Power BI Analysis: Merging Insights and Visualizations
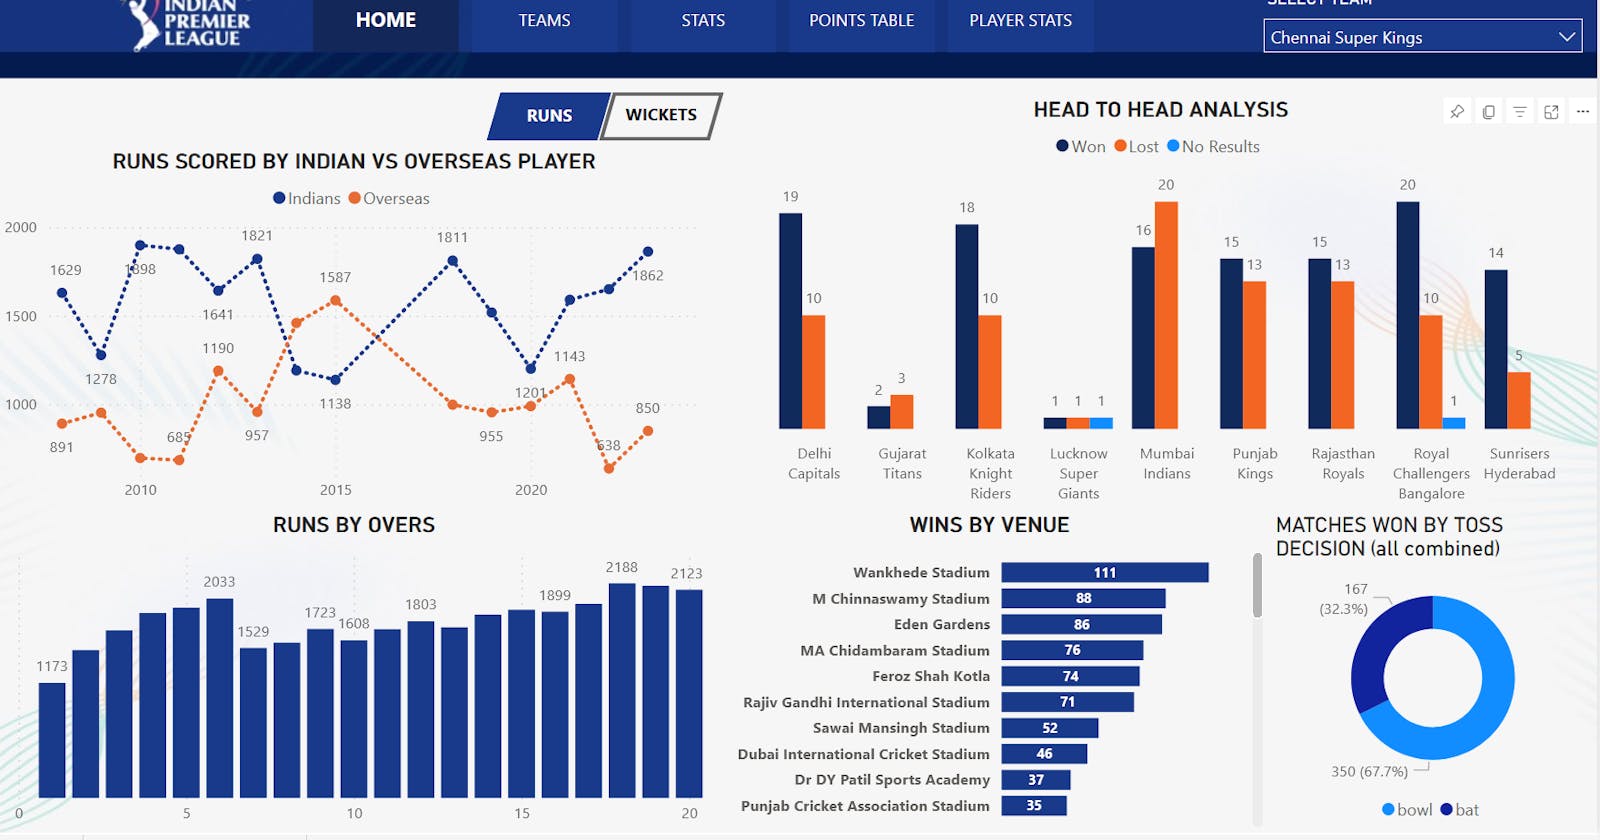
Transitioning from Python to Power BI, I employed a Python script within Power BI to import data from the Hugging Face dataset. This step marked the beginning of crafting a robust Power BI report, blending analytical insights with captivating visualizations.
If you want to use the IPL dataset for you project you can do so by executing the below python code in Power BI get data --> Python Script.
from datasets import load_dataset
import pandas as pd

ipl_ball_by_ball_data = load_dataset('bhuvaneshprasad/ipl-dataset', data_files={"ipl_ball_by_ball_data": "ipl_ball_by_ball_data.csv"})
ipl_batting_card = load_dataset('bhuvaneshprasad/ipl-dataset', data_files={"ipl_batting_card": "ipl_batting_card.csv"})
ipl_bowling_card = load_dataset('bhuvaneshprasad/ipl-dataset', data_files={"ipl_bowling_card": "ipl_bowling_card.csv"})
ipl_fow_card = load_dataset('bhuvaneshprasad/ipl-dataset', data_files={"ipl_fow_card": "ipl_fow_card.csv"})
ipl_historical = load_dataset('bhuvaneshprasad/ipl-dataset', data_files={"ipl_historical": "ipl_historical.csv"})
ipl_partnership_card = load_dataset('bhuvaneshprasad/ipl-dataset', data_files={"ipl_partnership_card": "ipl_partnership_card.csv"})
ipl_players_info = load_dataset('bhuvaneshprasad/ipl-dataset', data_files={"ipl_players_info": "ipl_players_info.csv"})

ipl_ball_by_ball_data = pd.DataFrame(ipl_ball_by_ball_data["ipl_ball_by_ball_data"])
ipl_batting_card = pd.DataFrame(ipl_batting_card["ipl_batting_card"])
ipl_bowling_card = pd.DataFrame(ipl_bowling_card["ipl_bowling_card"])
ipl_fow_card = pd.DataFrame(ipl_fow_card["ipl_fow_card"])
ipl_historical = pd.DataFrame(ipl_historical["ipl_historical"])
ipl_partnership_card = pd.DataFrame(ipl_partnership_card["ipl_partnership_card"])
ipl_players_info = pd.DataFrame(ipl_players_info["ipl_players_info"])
Tackling Challenges: A Power BI Learning Curve
Navigating through my second Power BI project presented a myriad of challenges. Initial data cleaning and modeling were completed without a clear roadmap for the final report. A realization that data modeling needed a reset prompted a meticulous restart. Addressing issues with loading images using web URLs required a creative solution—employing a mix of simple image visuals and tables.

Illuminating Insights: Learnings from IPL Data
The project offered a treasure trove of insights into various cricket metrics. Notably, a fascinating revelation surfaced—Siddharth Trivedi, last seen in 2013, held the title of the highest wicket-taker for the Rajasthan Royals. Beyond statistical revelations, I delved into the functionalities of Hugging Face datasets and spaces.

Conclusion
Despite the challenges encountered, the journey reached its zenith with the successful completion of the Power BI report. Embedded below are the fruits of this labor, encapsulating the fascinating discoveries derived from my End-to-End IPL data analysis.
